An alternate valuation model - Consistent Growth Model
A change from traditional valuation models which can help valuing and comparing companies better.
Most analyst’s report consists of valuing a company either via a Discounted Cash Flow Model (DCF) or a Future Price to Earning model (PE) or a combination of both by taking a Discounted Cash Flow Model for a period and entering an exit multiple at the end of the period. Consistent Growth model aims to bridge the gap between valuation models. Let’s understand the merits and flaws of each of the system.
Discounted Cash Flow Model -
The most popular model used for valuations where analysts and investors predict future free cash flows across a period and discount it with cost of equity to come up with value. The model is primarily used for a particular period i.e. 5/10 years and than assigned a terminal value based on estimate growth rate after the period till perpetuity.
Merits -
It is a very efficient model especially while valuing stable and mature companies.
DCF methodology may assist in staying out of economic bubbles.
DCF focuses on free cash flows which is a better metric to evaluate profitability rather than accounting profit in the long run.
Demerits -
1. There is no standard or correct way of estimating Beta for a stock and contrary views are taken for calculating beta of a stock or industry.
Cost of Equity = Risk Free Rate + (Market Premium - Risk Free Rate) * Beta
2. A change in cost of equity even by 1% can drastically change the valuation and make all companies undervalued or overvalued even if all the other assumptions remain the same.
3. It is difficult to estimate perpetual growth rate at the end of the model.
4. Discounted Cash Flow model usually does not take into account high growth companies which may grow for at a high rate for a number of years(higher than 5/10 years)
Future Price to Earning Ratio -
PE ratio is more of a pricing method rather than valuation method. Usually in this model one prices a stock relative to its peers. Future PE is calculated by estimating earnings growth and assigning a multiple to the stock relative to its peers. Pricing models such as P/BV (Price to Book Value) and EV/EBITDA have a similar approach.
Merits -
It is effective in bridging pricing mismatches across similar companies.
In modern day and age more often than not using the pricing approach can be more rewarding in a shorter period of time.
Majority of the modern day valuations (IPO's, acquisitions) are done using the pricing approach.
Demerits -
If the entire asset class or a sector is massively overvalued the pricing model doesn’t take into account and does not have the oversight to ignore bubbles.
Usually there is an estimation to assigning current or future multiples to a stock.
Consistent Growth Model -
Consistent Growth Model takes elements DCF approach and works on it. In consistent growth model, we take the estimated profit growth rate for a number of years till it reaches the PE it commands.
Example - A company growing at 10 percent and trading at 20 PE will have to grow at 10 percent for next 11 years to earn back the original investment.
Alternatively a company growing at 20 percent and trading at a 60 PE will need to grow at 20 percent for next 14 years to earn back the original investment.
While I understand that estimating growth rate for companies across decades is unlikely to be accurate but when one sees it this valuation model can be useful in relative valuation across multiple companies with different growth rates
The biggest companies in India and the world (Reliance, HDFC Bank, Amazon, Apple etc.) have given returns of over 20/30 percent CAGR across 2 or more decades which is impossible to comprehend in a traditional DCF and P/E model.
This model can also be used to capture and understand the potential scale of early growth companies and the growth required by a company across time to justify current valuations. The objective of the model is to understand and evaluate companies over a longer period of time.
Further in sectors like Consumer Goods in India where the valuations on a price to earning basis are incredibly high, these model can act as a normalizer or an indicator of why the market has valued a certain company at a certain valuation.
In India a handful of companies have managed to grown at a similar range.
One can also use the model to test alternative investments and compare equity with the same.
For example - Let's say a FD gives a return of 6% , it should trade at a PE of 16.66 and it will take 12 years to earn back the original investment back at 6%.
Demerits -
Like most models there are flaws in the system, one being attempting to estimate growth rate for large periods of time which can be difficult to estimate.
Here are some examples of some companies and how they fit in a PE v/s DCF v/s Consistent Growth model.
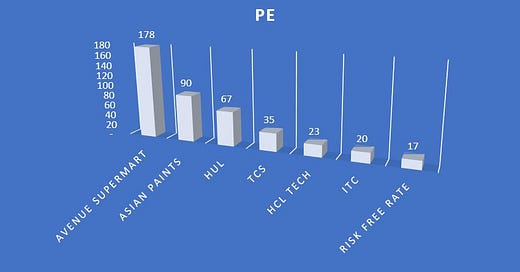
PE Basis - On a pure term PE basis Avenue SuperMart seems the most expensive with a PE of 178 whereas a risk-free deposit seems the cheapest of the above companies where the risk free rate is considered at 6%.
Discounted Cash Flow -
Here are the assumptions used in the Discounted Cash Flow.
Growth Rate - Avenue SuperMart - 28% (in line with its 5 year CAGR)
Asian Paints - 14% - In line with its 10 year CAGR
HUL - 15% In line with its 10 year CAGR
TCS - 14% In line with its 10 year CAGR
Risk Free Rate - 6%
HCL Tech - 12% slightly lower than the market leader
ITC - 10%
Risk Free Rate - 6%
HCL Tech - 12% slightly lower than the market leader
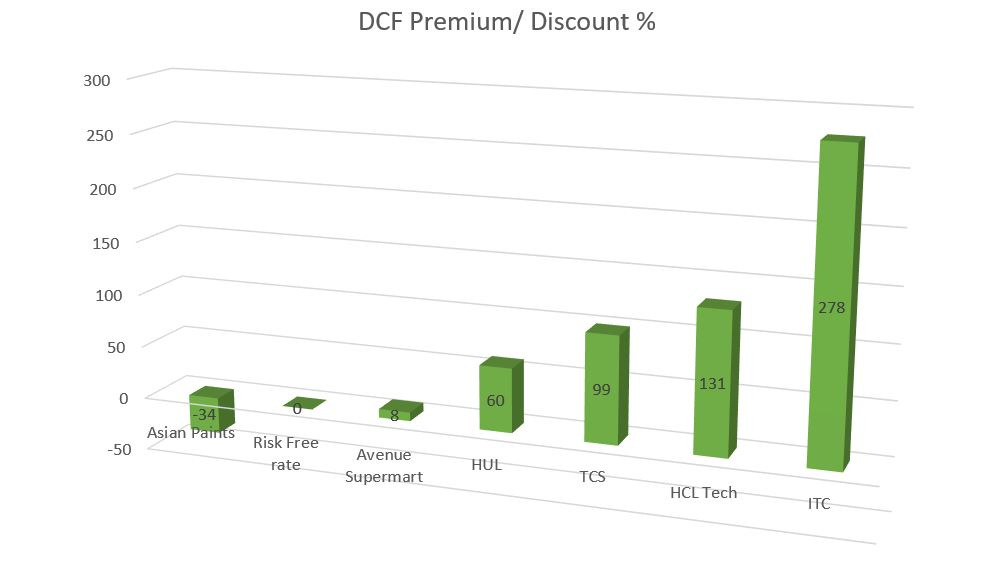
Market Premium is taken at 12%, the return of Nifty 50 since inception and Beta is taken on a stock specific basis against Nifty 50. Here are the valuation differences the above model shows with Asian Paints being the most expensive investment and ITC being the best investment.
Disclosure - I do not use the above DCF model for my valuations, it is only for the simulation.
Consistent Growth Model -
After running the same above growth assumptions, in consistent growth model, ITC and HCL Tech are seemingly the best investments and Asian Paints is the most expensive investment from the lot. The number of years above indicate the amount of time the below investments will take to earn back the money if you invest as on 28th May 2021.
If you have faith in the above companies to grow for more than the years above at the same rate and you have a longer investment time horizon than the above years, the investment in the above companies would make more sense. You can also tweak the same by changing your growth estimates and making the decision or by using different growth rates for different years to come to a conclusion.
Conclusion - Different models throw out different conclusions, for a comparison the below chart showcases the best and worst investments across different models. With 1 being the best and 7 being the worst.
Based on the above you can see how different valuation model agree and disagree simultaneously even if you take the same metrics in consideration.


can you explain what's the logic behind this... A company growing at 10% trading at 20 pe will take 11 years to earn back the original investment?
Excellent thought process and outlining of the continuous growth model. It is perhaps one step removed from being close to the “holy grail” - valuation premium / discount factors due to purely share ownership / market reasons (may not be directly related to YoY financials) like free float, pledges, trends in ownership of the supposed “smart money”, etc. I understand this is difficult to “model”, but that’s the missing link between what excel things and what the market thinks. I also see how you may say PE is supposed to do this, but as we all know PE rations (and other pricing ratios) are seldom accurate
If you agree, happy to collaborate to think through how this gap can potentially be bridged.